Trace every agent.
Every decision.
Every failure.

Top 300 in AWS AIdeas Global Competition (Ongoing)

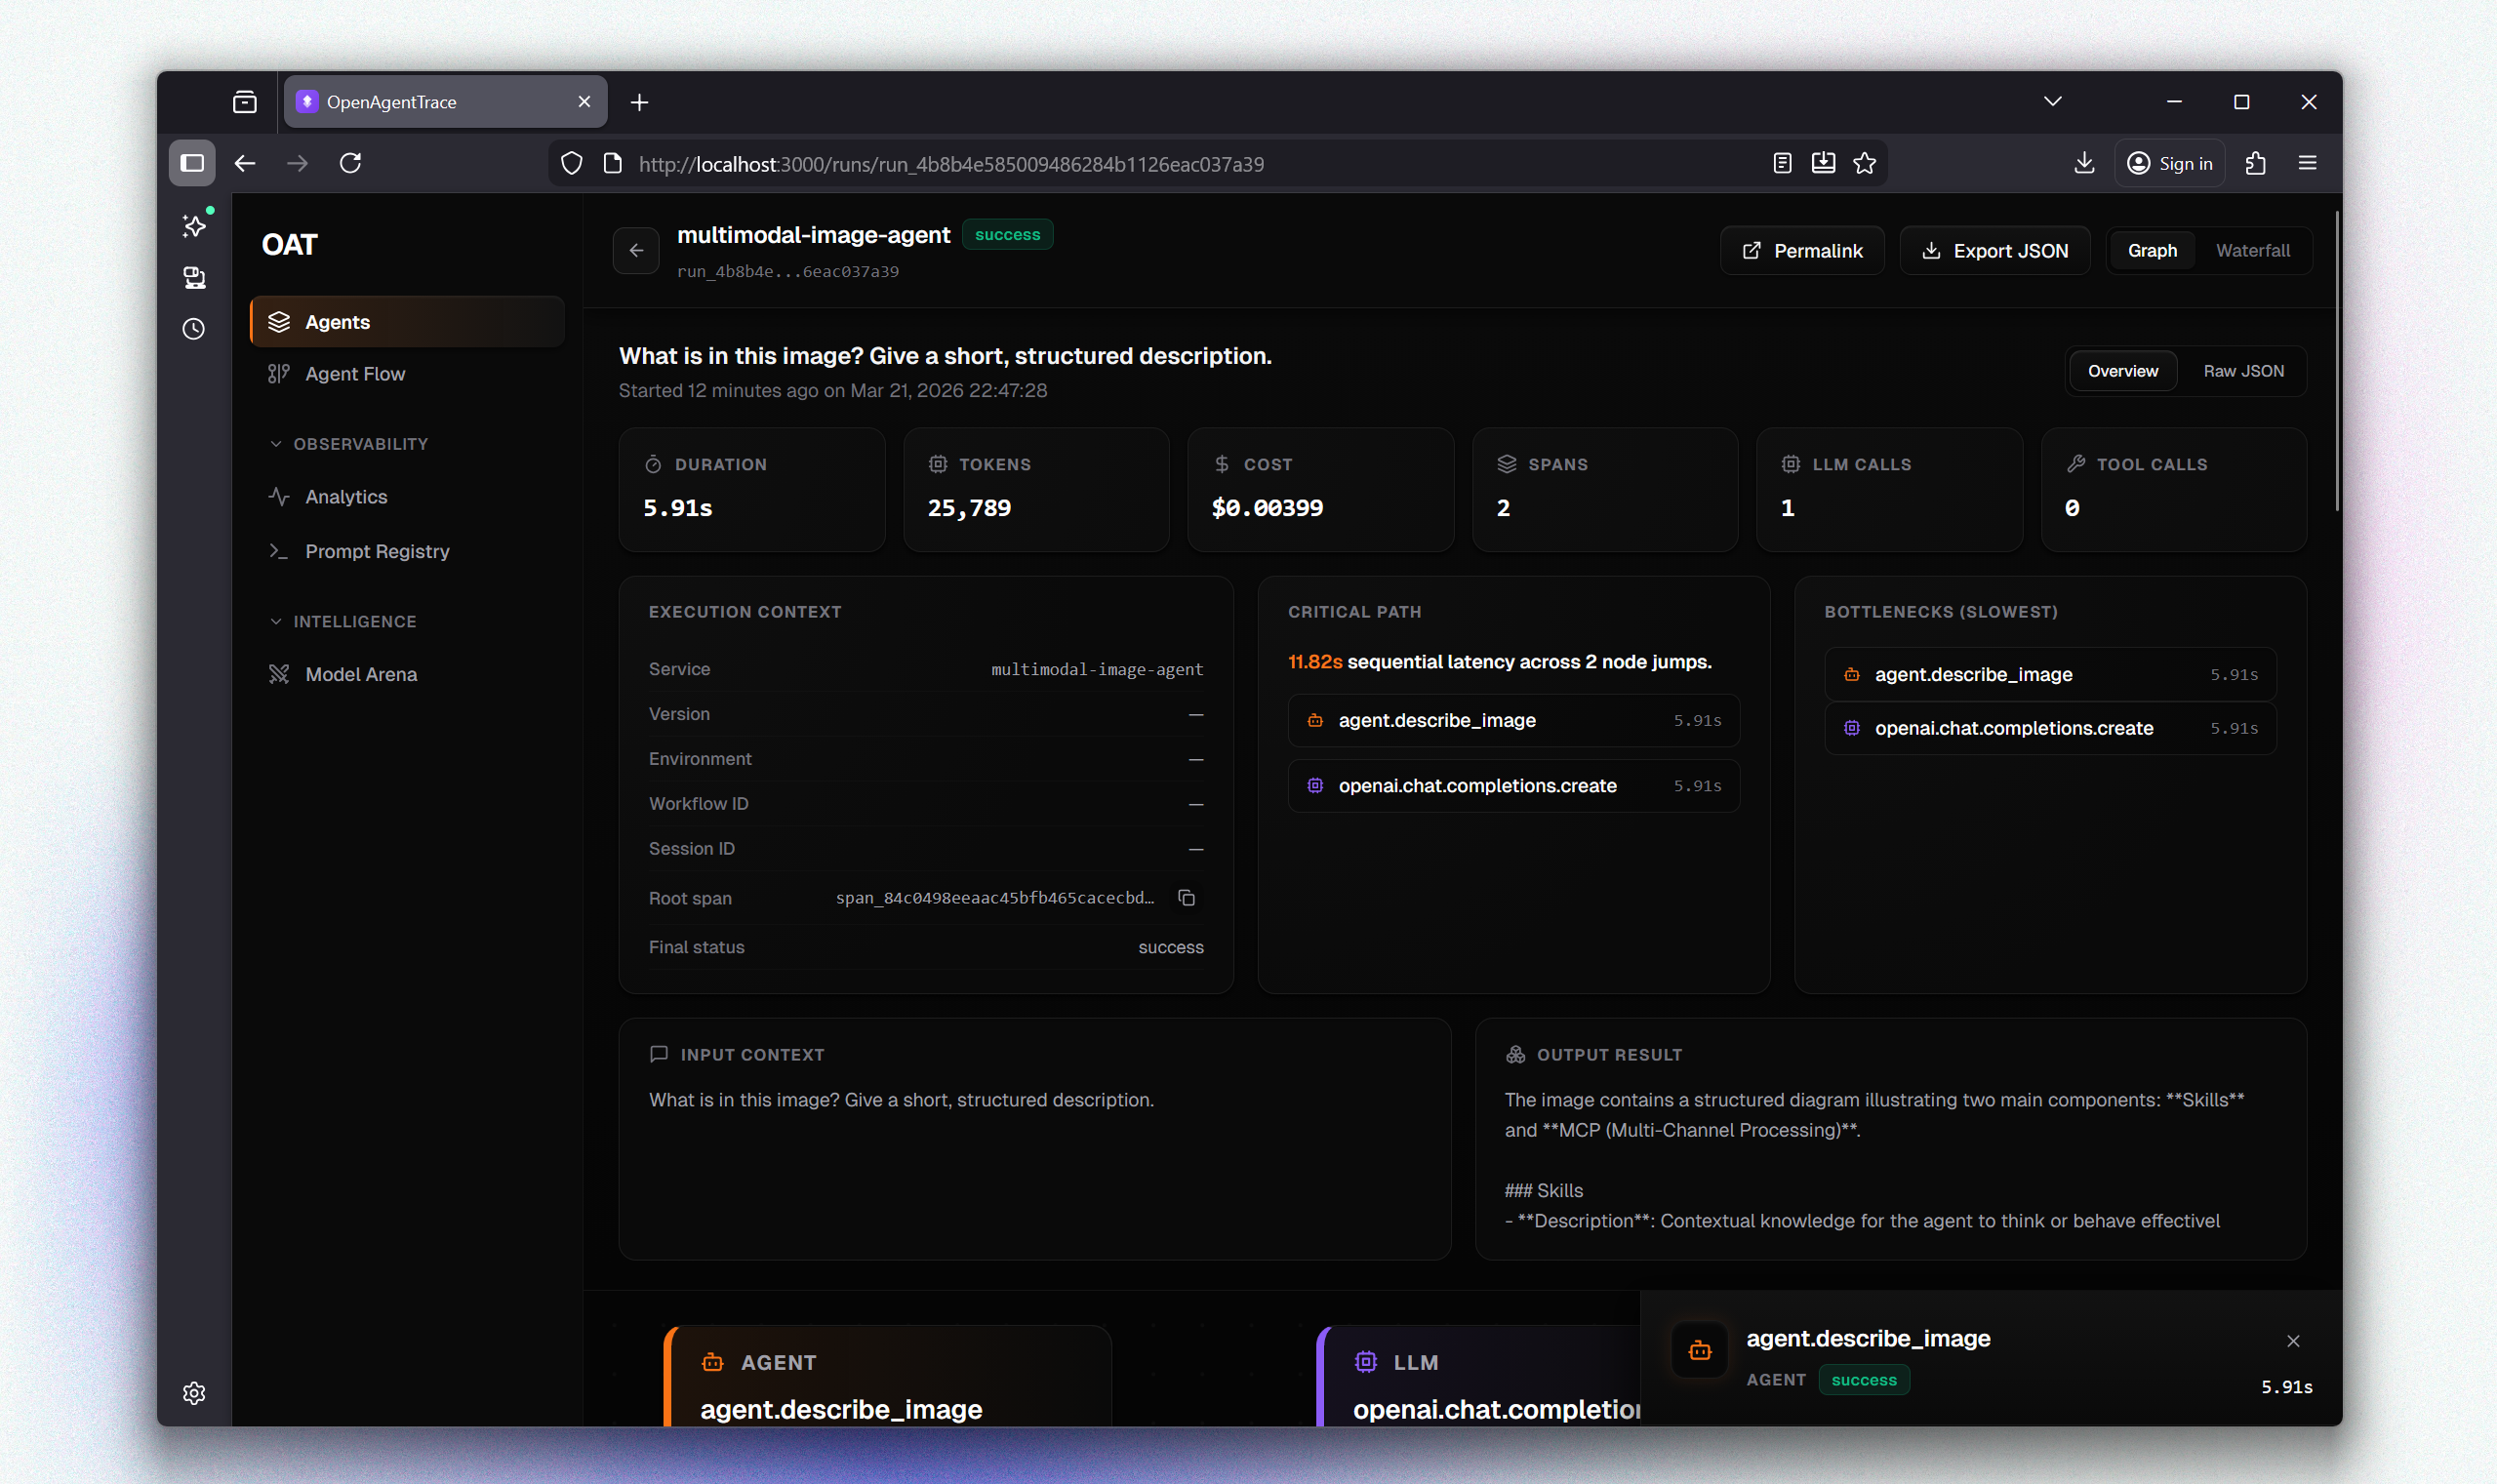
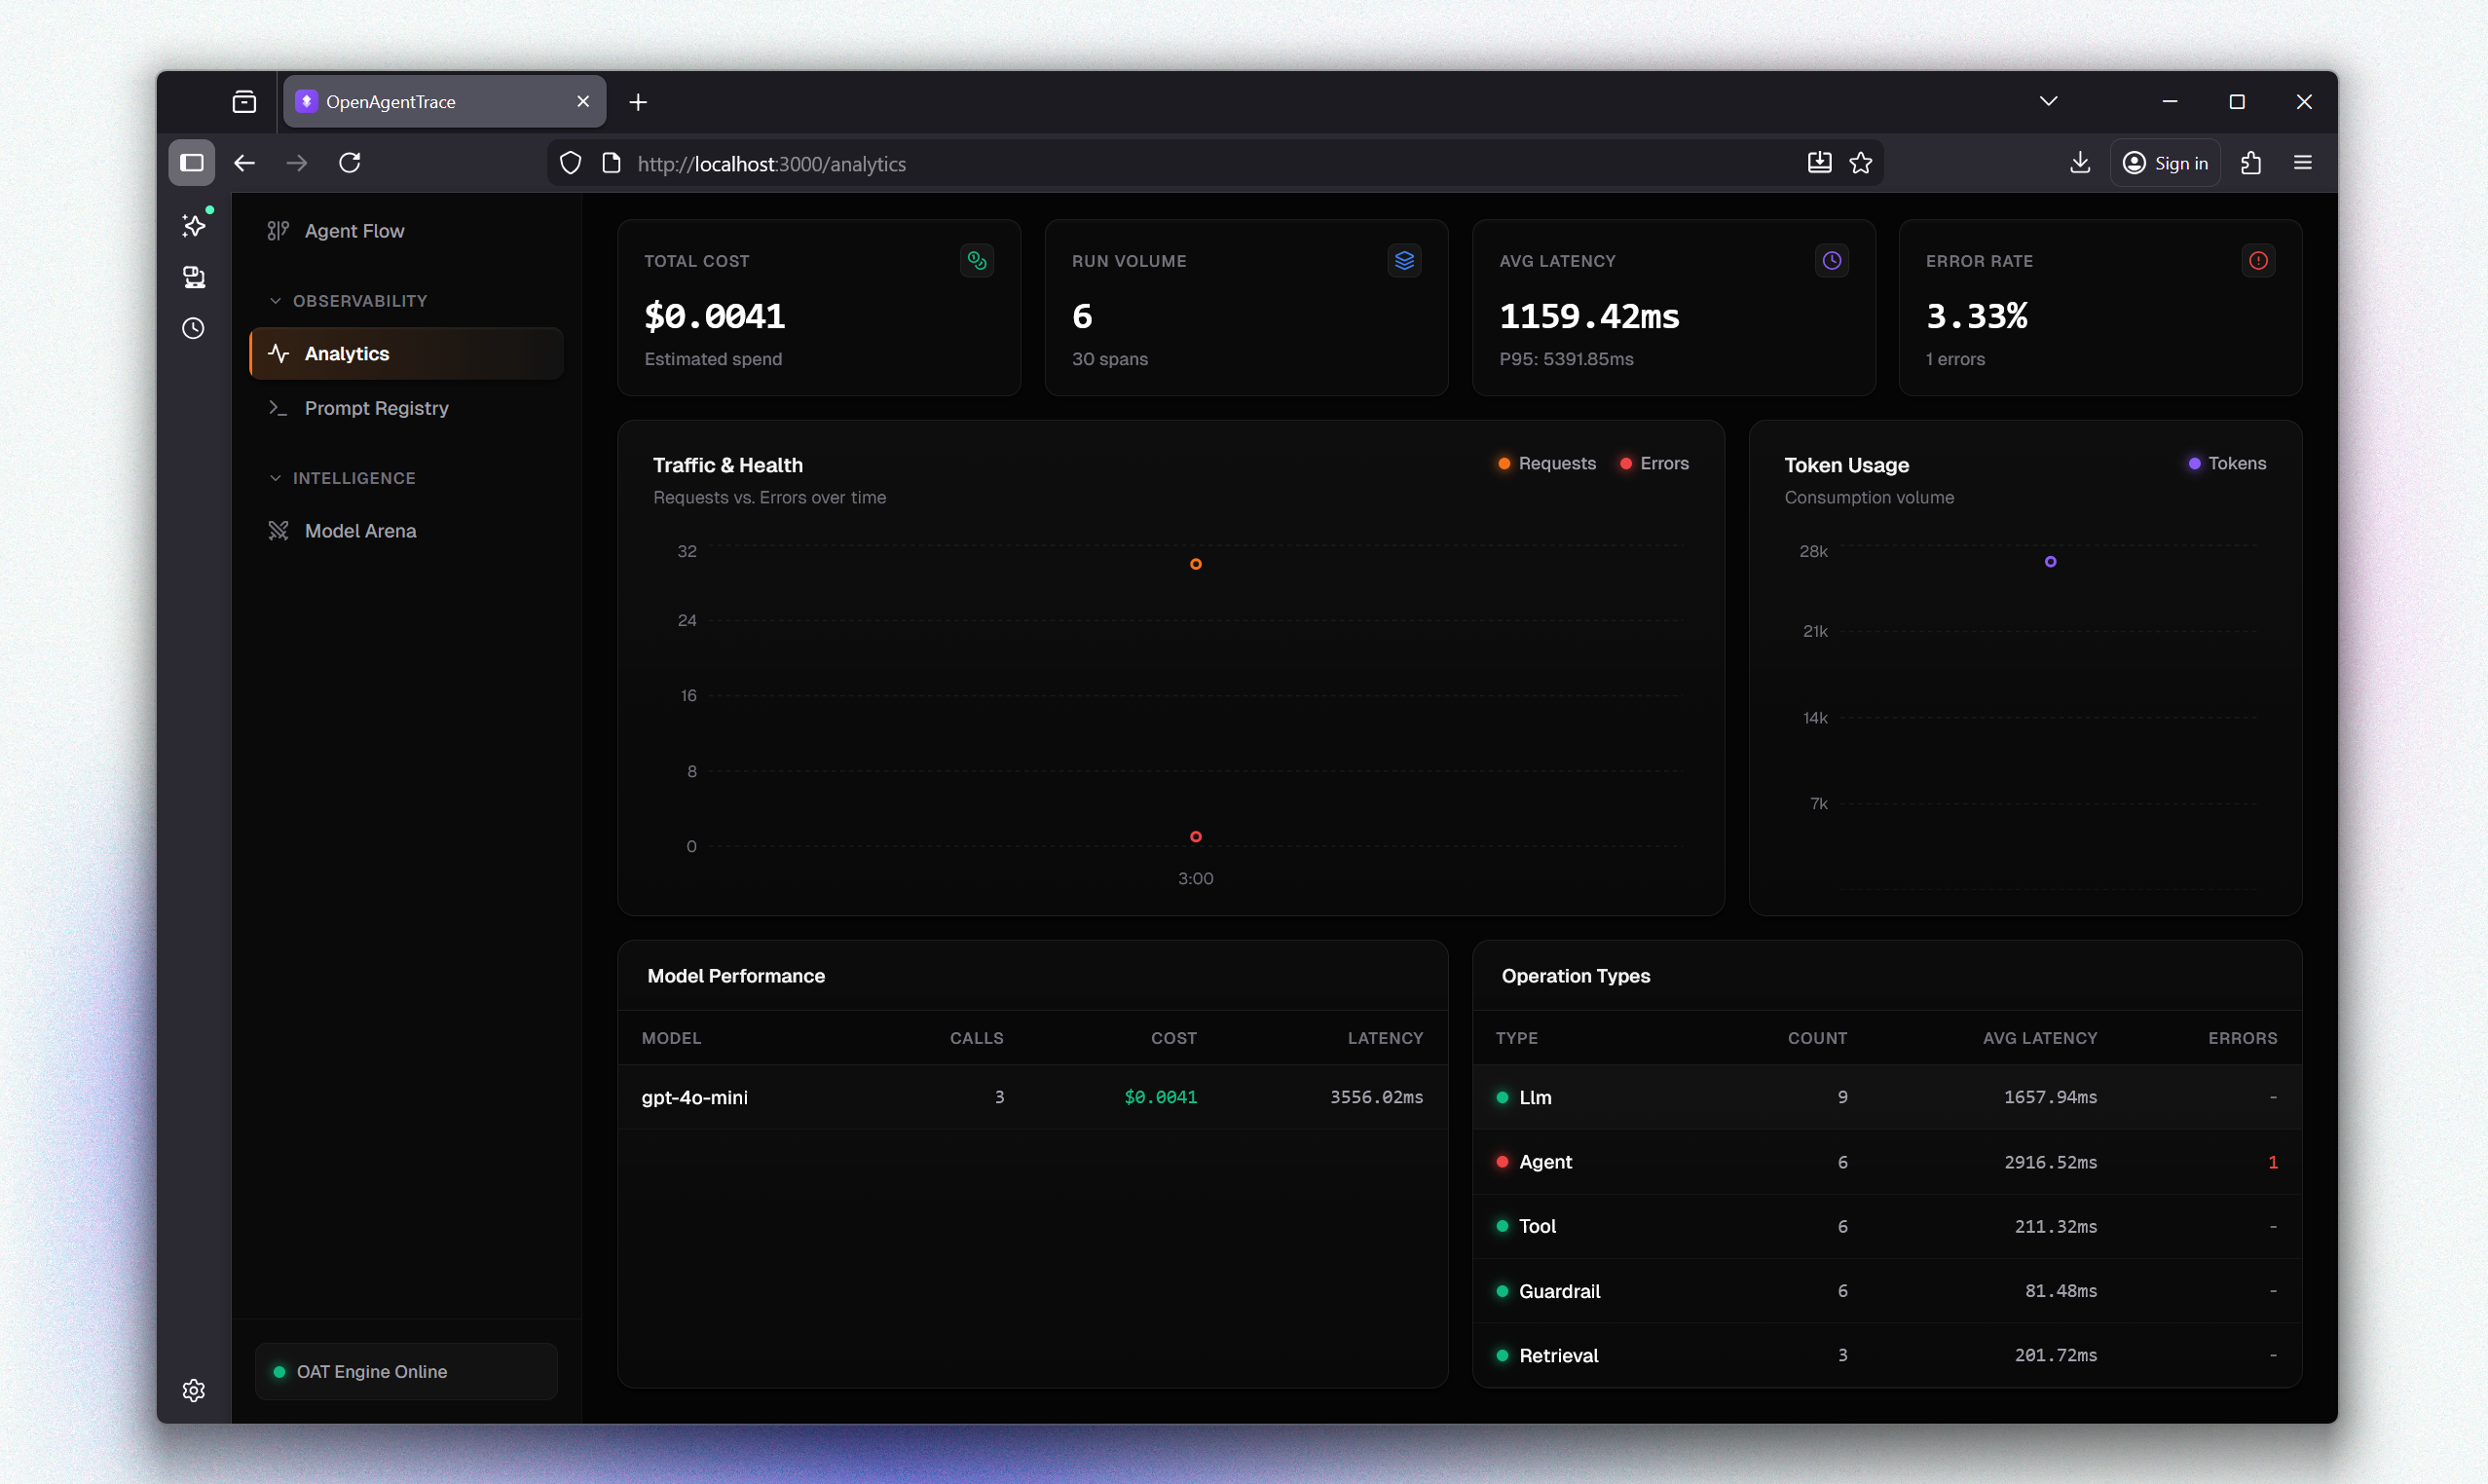
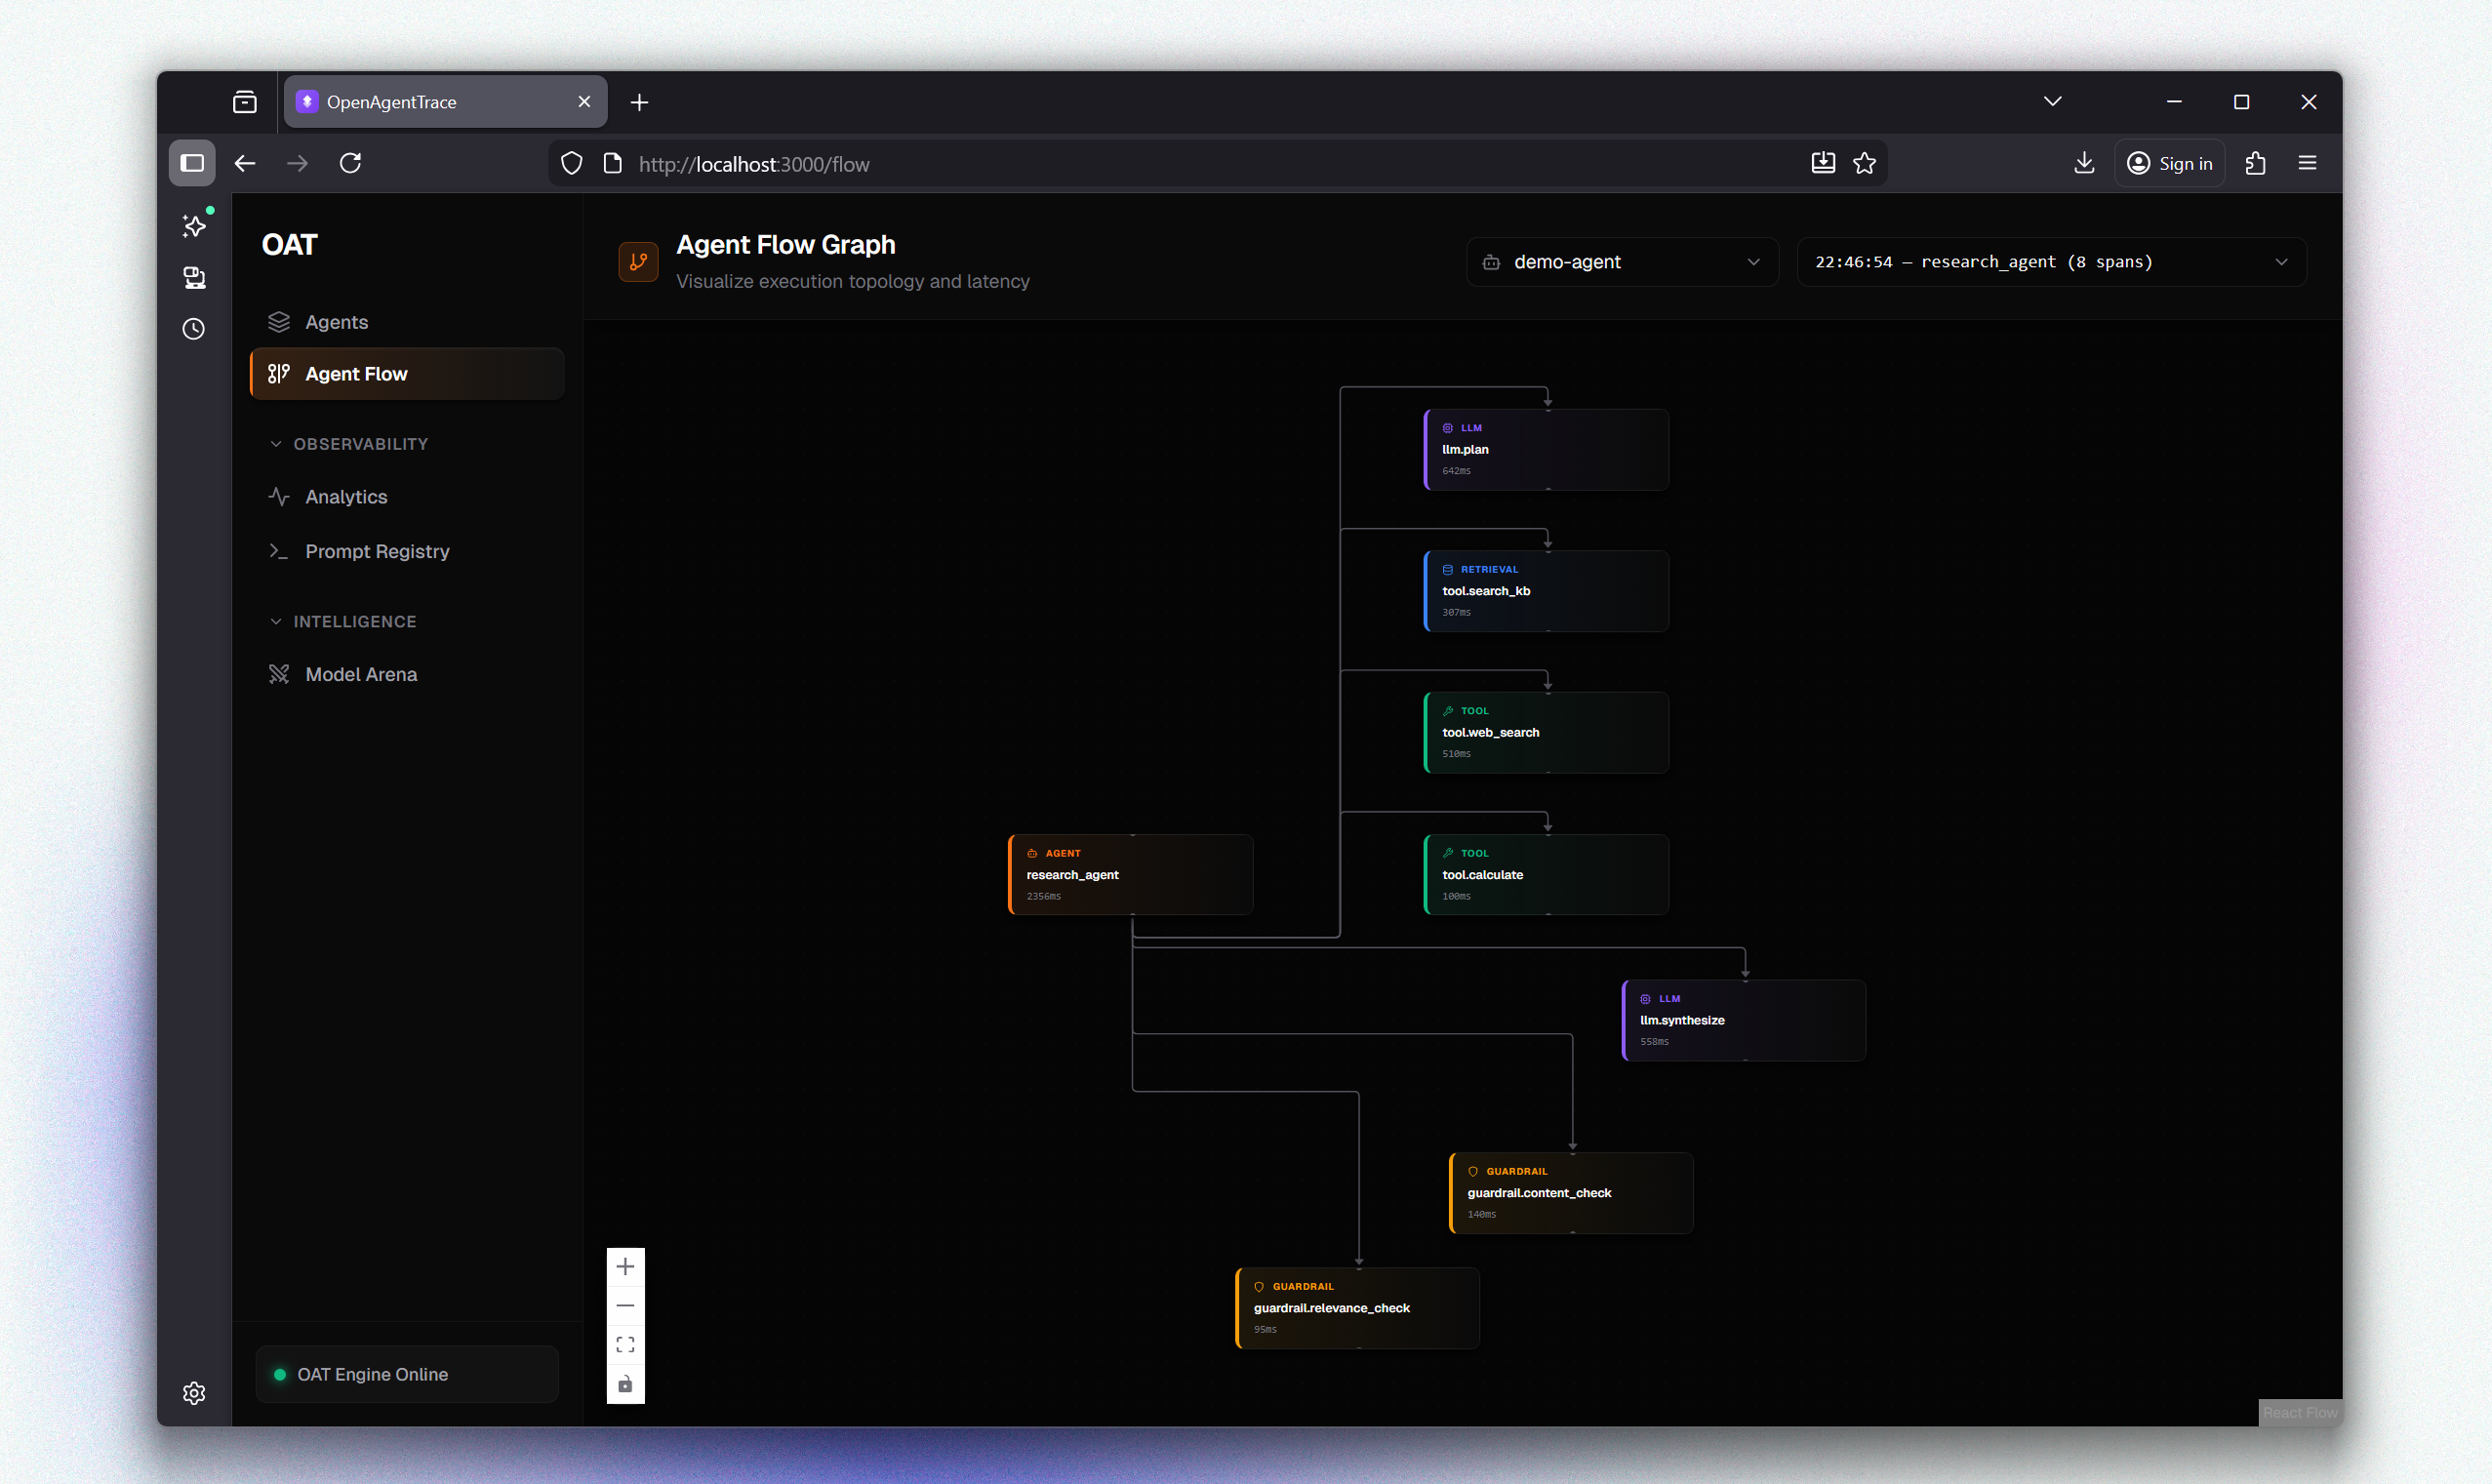
Free and open-source observability for AI agents. Stop debugging black boxes with full execution visibility across prompts, tools, retrieval, artifacts, costs, and failures.

Watch Demo V1

About OpenAgentTrace

Beyond logging.
Full observability.

OpenAgentTrace (OAT) is an open-source, local-first observability stack for AI agents and LLM applications. It records every LLM call, tool invocation, retrieval step, guardrail check, prompt, output, token count, cost, timing, and error.

The product has three parts: a Python SDK that instruments agent code with decorators, context managers, or provider patching; an optional FastAPI backend that ingests and stores trace data; and a React dashboard that lets teams inspect runs, spans, artifacts, analytics, prompt history, flow graphs, and model comparisons.

Product

Three components.
One stack.

01 / SDK

Python SDK

Decorators, context managers, and auto-patching for OpenAI, Anthropic, Gemini, and Ollama. Three lines to first trace.

from oat import trace
@trace(name="agent")
def run(q):
    return ask(q)

02 / Dashboard

Full observability UI

Inspect runs, trace trees, artifacts, analytics, prompt history, flow graphs, and compare models in the arena. React frontend backed by FastAPI.

03 / Deployment

Run anywhere

Local SQLite + blob files for dev. Self-hosted FastAPI + React for teams. Serverless on AWS (Lambda, API Gateway, RDS, S3) for production. Your data stays wherever you put it.

The Problem

Agents are black boxes.

Traditional logging and APM tools were built for deterministic HTTP services. AI agents need purpose-built observability.

Silent failures

Bad JSON, timeouts, guardrail misfires. Nothing tells you what broke or why.

No causal flow

Flat logs cannot show why step B followed step A or which retry spiked costs.

Hidden costs

Token spend is buried across providers and retries. Attribution is impossible.

No audit trail

Regulated teams must prove what the agent did, accessed, and produced.

How It Works

Code to trace in seconds.

agent.py
1from oat import trace, patch_openai
2patch_openai() # auto-instrument
3
4@trace(name="researcher")
5def run_research(topic):
6    data = search_web(topic)
7    summary = summarize(data)
8    return summary
Terminal Output
$ python agent.py
o researcher started
|-- search_web ....... 1.2s done
| +-- "Quantum Computing 2026"
|-- llm_call ........ 2.4s done
| +-- 1,240 tokens ($0.04)
+-- Status: SUCCESS / 3.6s
➜ Trace saved. Open dashboard.

Integrations

Supported Models & Providers

OpenAI Logo

OpenAI

Sync/Async, Streaming, Multimodal

Anthropic Logo

Anthropic

Streaming, Multimodal, Stop-Reasons

Google Gemini Logo

Google Gemini

Content Generation, Streaming

Ollama Logo

Ollama

Local Models, Image Capture

OpenRouter Logo

Compatible

Groq, Mistral, vLLM, OpenRouter

Architecture

Any Agent Type Supported

OAT

Single-Agent

Explicit runs, nested spans.

Tool-Using

Dedicated helper, first-class citizen.

RAG Agents

Retrieval spans, helper APIs.

Iterative & ReAct

Loop tracking, hierarchical iterations.

Guardrailed

Modeled as spans for causal flow.

Distributed & Workers

Context propagation for services.

The Interface

See inside the black box.

A purpose-built React frontend designed specifically for understanding complex, non-deterministic agent architectures.

Trace Dashboard

Deep Dive Trace Inspection

Navigate a hierarchical tree of every span your agent executed. Inspect raw JSON payloads, view exact token counts, and see attached multimodal artifacts attached to every specific function call.

  • Span-level timing and latency metrics
  • Full Prompt and Generation text inspection
  • Expandable JSON input/output viewer

Token & Cost Attribution

Stop guessing where your API budget is going. OAT tracks token usage and calculates precise dollar costs per run, per model, and per tool. Identify retry loops that are burning through tokens.

  • Cost breakdown by LLM provider
  • Run volume and latency trends over time
  • Success vs. Failure rate tracking
Analytics Dashboard
Flow Graph Dashboard

Visual Flow Graphs

Visualize your agent's decision-making process. The Flow Graph turns complex hierarchical traces into an easy-to-read, node-based visual map of how data moved through your system.

  • Node-based dependency mapping
  • Identify bottlenecks visually
  • Pan and zoom complex architectures

Testimonials

What people are saying

"We spent 3 weeks debugging why our agent started hallucinating. Your tool would've caught it in 10 minutes."

CEO
Doorlist (Series A SaaS)

"Agent observability is crowded but regulated projects need local-first solutions. Multimodal-observability is sparsely addressed by any of them."

Deployment Lead
Palantir

"We built internal observability that looks like your screenshots. We'd gladly pay to stop maintaining it."

CTO
Chasi (YC W26)

"Standard APM tools struggle with non-deterministic agent loops. OAT gives us the causal visibility we couldn't get elsewhere."

SWE
Datadog

Deployment

Your data. Your rules.

Local-First

SQLite + blob files on your machine. Zero network calls. Built for privacy-sensitive and regulated environments.

Self-Hosted

FastAPI + React on your infrastructure. Full control over data, retention, and access. Team-wide observability.

Serverless AWS

Lambda, API Gateway, RDS, S3, Amplify. Auto-scaling, fully managed production architecture.